

Cardiology Revenue Cycle KPIs: 12 Metrics Every Practice Should Track

A cardiology group can post a healthy collections total for the month and still lose money on its echo lab. The reason is that blended numbers hide where cash stalls. Tracking cardiology revenue cycle KPIs by category, payer, and service line shows the leak before it reaches the quarterly report.
The twelve metrics below are grouped into three sets: cash flow, claim quality, and cardiology-specific controls. Benchmarks are included where a named source supports them. Where none exists, the text says so.
Why cardiology revenue cycle KPIs need a different lens
General practice benchmarks assume a visit-based model. Cardiology revenue comes from a mix of office visits, in-office diagnostics (ECG, transthoracic echocardiography, nuclear stress testing), hospital-based procedures, and device monitoring. Each stream has its own coding rules, authorization requirements, and payer behavior.
Standard definitions help. The Healthcare Financial Management Association (HFMA) publishes 29 MAP Keys across five revenue cycle domains, with fixed equations and data sources so that two organizations calculate "denial rate" the same way. Several of the metrics below follow MAP Key definitions, including net days in accounts receivable (FM-1), remittance denial rate (AR-5), and denial write-offs as a percentage of net patient service revenue (AR-6).
Payment pressure adds urgency. CMS released the CY 2026 Medicare Physician Fee Schedule final rule (CMS-1832-F) on October 31, 2025, effective January 1, 2026. It set two conversion factors for the first time: $33.5675 for qualifying APM participants and $33.4009 for everyone else, up 3.77% and 3.26% from 2025, according to Becker's coverage of the rule. It also applied a -2.5% efficiency adjustment to work RVUs for non-time-based services, a category that includes diagnostic imaging. The American College of Cardiology reported that CMS projects a 1% increase in payments to cardiology overall, though the actual effect depends on each practice's service mix. A group that cannot see its own mix by code cannot tell which side of that average it sits on.
Cash flow metrics
1Net days in accounts receivable
This is the average number of days it takes to turn billed services into cash. HFMA's MAP Key FM-1 divides net A/R by average daily net patient service revenue. Billing consultancies commonly cite a target range of 30 to 40 days for ambulatory practices, with the best performers at 25 or fewer.
One caution: the figure falls when a billing office writes off balances quickly, so a falling number can mean faster collection or faster surrender. Read it next to metric 3.
2A/R over 90 days
Take the dollars aged past 90 days and divide by total A/R. A common target is below 15%, and many practices also watch the 120-day bucket. Cardiology tends to accumulate old balances in two places: unresolved denials on imaging, and secondary claims waiting on a primary payer's remittance.
Segment this by payer. A single slow commercial plan can account for most of the old balance.
3Net collection rate
Collections divided by the amount owed after contractual adjustments. Suppose a practice bills $2,000,000, expects $1,100,000 after contractual allowances, and collects $1,056,000. The net collection rate is 96%. Sources citing the Medical Group Management Association (MGMA) place the benchmark above 95%.
Net Collection Rate = Collections ÷ Expected Reimbursement × 100
A result below that range usually points to preventable write-offs, not a contract problem.
4Charge lag
The days between date of service and charge entry. Medicare's timely filing limit is one calendar year from the date of service, so the real risk is not Medicare. It is the commercial plans with 90-day windows, where a cath lab charge that sits unreconciled for three weeks eats a quarter of the allowance.
No single published benchmark covers cardiology. Most groups set an internal ceiling (many choose two to three business days for office services) and review exceptions weekly.
Claim quality and denial metrics
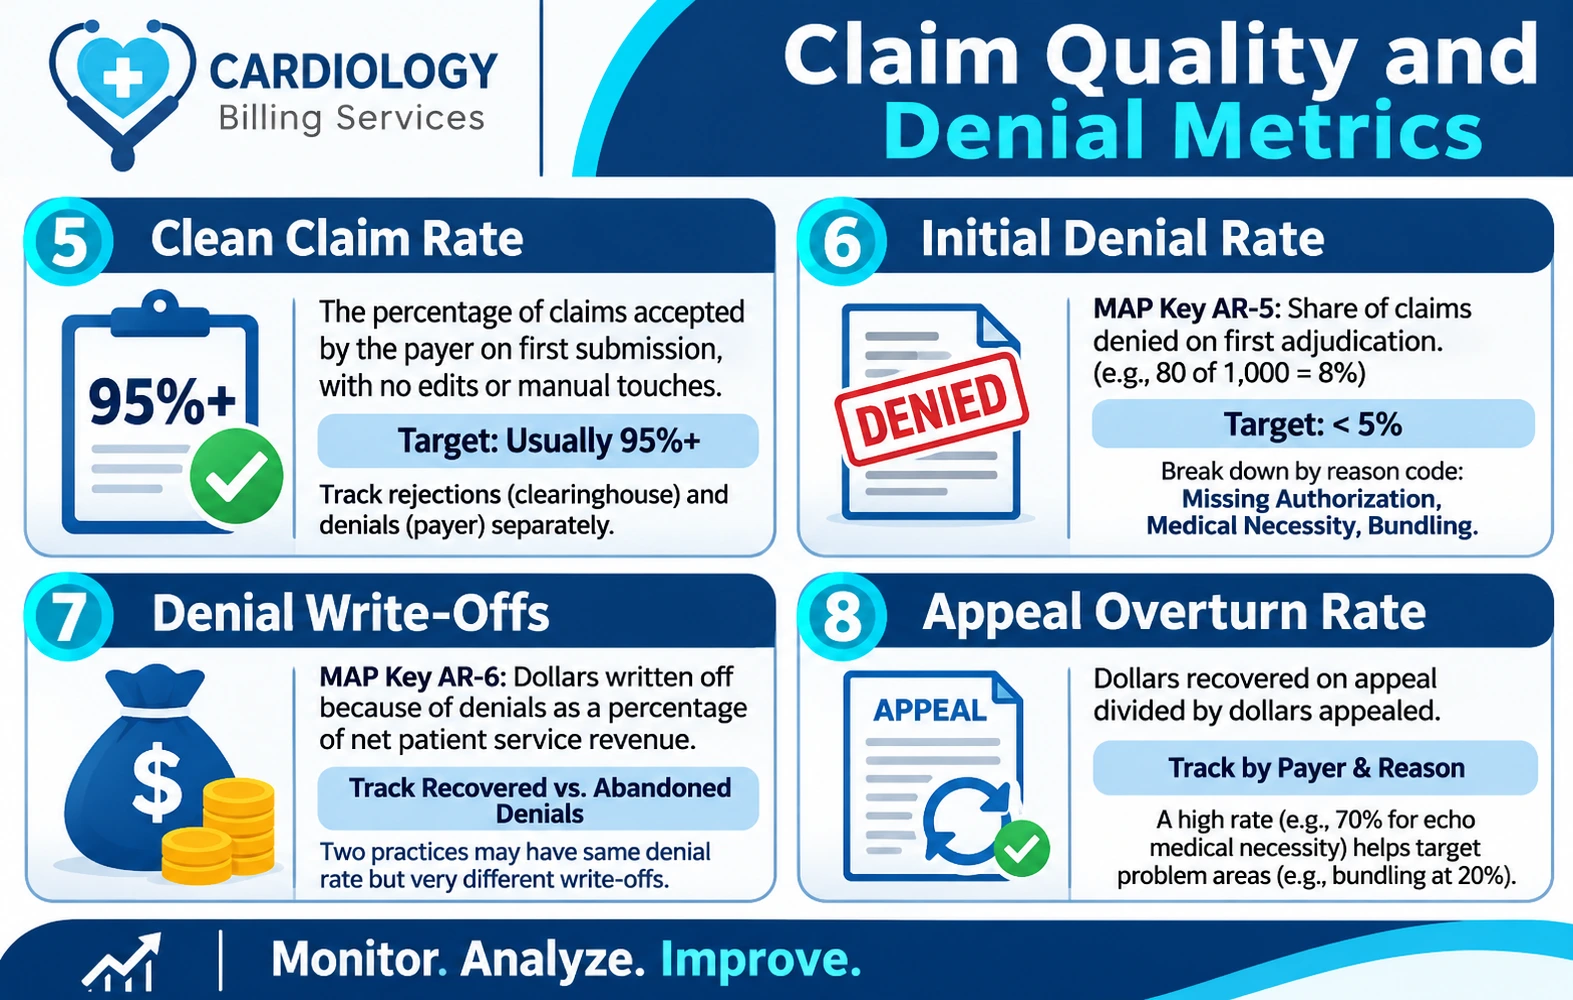
5Clean claim rate
The percentage of claims accepted by the payer on first submission, with no edits or manual touches. Targets published by billing vendors usually begin at 95%. Track rejections at the clearinghouse separately from denials at the payer, because the fixes belong to different teams. Rejections are usually demographic or formatting errors. Denials usually involve coding or medical necessity.
6Initial denial rate
MAP Key AR-5 defines the remittance denial rate as the share of claims, by volume or dollars, that a payer denies on first adjudication. If 80 of 1,000 submitted claims are denied, the rate is 8%. Many sources set a target under 5%.
Break it down by reason code. Missing authorization, medical necessity, and bundling edits behave differently in cardiology than in primary care.
7Denial write-offs
MAP Key AR-6 measures dollars written off because of denials as a percentage of net patient service revenue. It separates denials a practice recovers from those it abandons. Two practices with identical denial rates can have very different write-off rates if one appeals and the other does not.
8Appeal overturn rate
Dollars recovered on appeal divided by dollars appealed. Track it by payer and denial reason. A payer that overturns 70% of echo medical-necessity appeals but only 20% of bundling appeals tells the team where to spend its hours. If a low overturn rate persists for one reason code, the problem sits upstream, in documentation or coding.
Cardiology-specific metrics
9Authorization-related denial rate
Advanced imaging such as nuclear stress testing (for example CPT 78452) and some echocardiography are subject to prior authorization or radiology benefit management review under many commercial and Medicare Advantage plans. Count denials coded as no authorization, expired authorization, or mismatched CPT code against the authorization on file, and divide by total denials and by total claims for authorized services.
A mismatch is the common variant: the order was approved for one code and the performed study billed under another.
10In-office diagnostic charge capture
Practices that own their equipment bill a technical component (modifier TC) and a professional component (modifier 26), or a global charge when both are performed by the same entity. Reconcile the number of studies performed (from the echo or nuclear lab's own log) against the number of charges billed. A gap of even 2% in a busy lab is a recurring revenue loss, since each missed study is simply unbilled.
This audit rarely appears in generic RCM dashboards, which is why it belongs here.
11Point-of-service collection rate
HFMA tracks point-of-service cash collection as a MAP Key. For cardiology, the concern is high-deductible plans: a patient with a $3,000 deductible who undergoes a nuclear study owes a sizable balance that grows harder to collect after discharge. Measure the share of estimated patient responsibility collected at or before the visit.
12Payer yield against Medicare
Express each commercial contract as a percentage of the Medicare fee schedule for your top 20 CPT codes. Because Medicare's 2026 non-APM conversion factor is $33.4009, a contract tied to a percentage of Medicare moves when CMS moves, while a fixed-dollar contract does not. Compare actual paid amounts to contracted rates monthly. Underpayments of a few percent are common and rarely noticed without a line-level audit.
How to set up the dashboard
Build a consistent KPI review process
Pick one owner per metric. Review aging and denials weekly, collection rates monthly, and payer yield quarterly. Compare each figure against the practice's own prior twelve months before comparing it to any published benchmark, since payer mix, hospital affiliation, and in-office imaging volume all change what "normal" means.
Students in billing and coding programs can apply the same structure to a case study: pick one denial reason, trace it to its owner, and calculate its dollar effect on metrics 1, 3, and 7. A practice that tracks these cardiology revenue cycle KPIs against its own baseline, segments them by payer and service line, and reconciles diagnostic volume to charges will find most of its recoverable revenue within a single quarter of data.